
- USD/JPY whipsaws lower and then higher on alternating risk-on risk-off caused by Middle East tensions.
- Governor Ueda talks about defending the Yen from further weakness and currency-induced imported inflation.
- USD/JPY price chart shows bearish Hanging Man forming, boding ill for future price action.
USD/JPY is trading in the 154.50s on Friday after declining to a low for the day in the 153.00s on the back of a spike in safe-haven demand that disproportionately favored the Japanese Yen (JPY).
An escalation in Middle East tensions, triggered a flight to safety overnight after news of bomb explosions in Iran. The attacks were thought to be orchestrated by Israel in retaliation for the drone armada sent by Iran on April 13.
Although the US Dollar benefited from the flight to safety, JPY gained more from the shift in sentiment, pushing down USD/JPY which expresses the number of Japanese Yen purchasable with one US Dollar.
The pair subsequently recovered as tensions eased, however, and a senior Iranian official reportedly stated Iran has no immediate plans to retaliate, according to Reuters.
Inflation ticks lower but Ueda adopts hawkish tone
On the data front, the Japanese National Consumer Price Index (CPI) for March increased by 2.7% year-over-year, compared to a 2.8% rise in February, according to the Japan Statistics Bureau.
Despite the decline in inflation observed in the data, however, the Governor of the Bank of Japan (BoJ) Kazuo Ueda issued hawkish rhetoric supporting the Japanese Yen. Ueda said the central bank might consider raising interest rates again if significant declines in the Yen caused currency-related inflation, according to Reuters.
Technical Analysis: USD/JPY looks to post bearish Hanging Man pattern
USD/JPY looks like it may be positing a bearish Hanging Man candlestick pattern on Friday (circled) assuming the close does not differ markedly from the current market price.
If the Hanging Man completes and is followed by a bearish candlestick on Monday it will confirm a short-term bearish reversal pattern and indicate lower prices are likely to follow.
USD/JPY Daily Chart
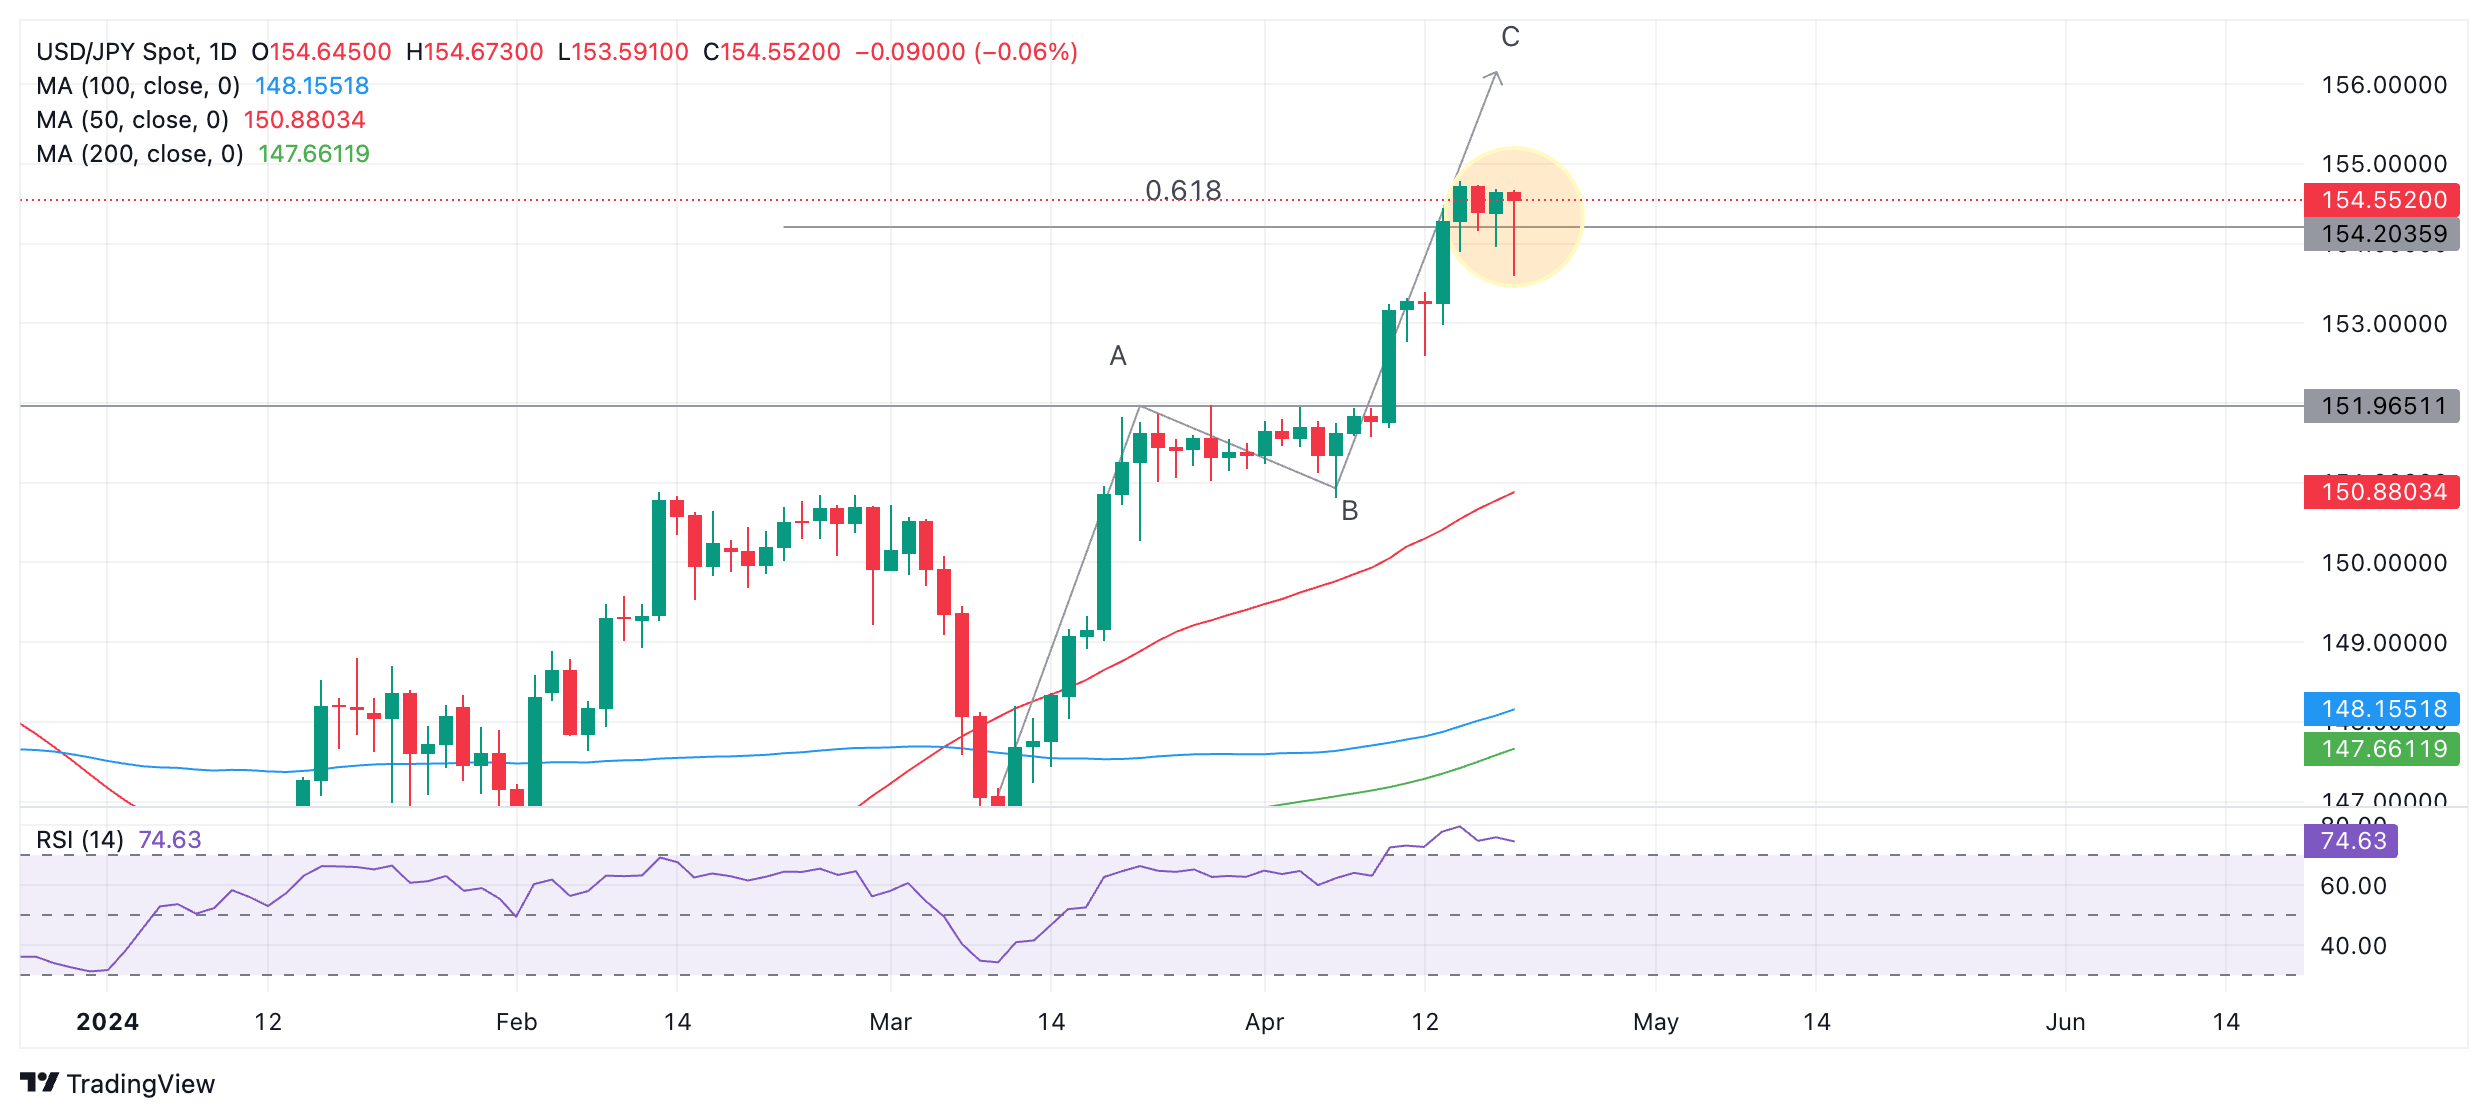
A Measured Move price pattern, composed of three waves, commonly labeled A, B and C has been unfolding since the start of March.
The general rule with these patterns is that the end of wave C can be estimated as occurring where wave C is equal in length to wave A, or a Fibonacci ratio of wave A. At the very least C normally extends to a 0.618 ratio of A.
USD/JPY has already reached the conservative estimate for the end of wave C at the Fib. 0.618 extension of A, at 154.20. This means there is a possibility C may have reached its limit and the Measured Move could be complete.
Once the Measured Move completes it is usually followed by a reversal, which in this case means a decline.
If the end of C equals A, however, it still has higher to go and could reach roughly 156.11.
The Relative Strength Index (RSI) is in overbought territory, suggesting the risk of a pullback is on the horizon. The advice is for bullish traders with a medium-term outlook to not add to their positions. If RSI exits overbought it may be a sign USD/JPY is pulling back.
A break above the 154.78 high could indicate a continuation of the uptrend to the next target at the more 156.11 optimistic end of wave C.
Alternatively, further weakness could lead to a correction back to support at the top of wave A, at 151.96.
Information on these pages contains forward-looking statements that involve risks and uncertainties. Markets and instruments profiled on this page are for informational purposes only and should not in any way come across as a recommendation to buy or sell in these assets. You should do your own thorough research before making any investment decisions. FXStreet does not in any way guarantee that this information is free from mistakes, errors, or material misstatements. It also does not guarantee that this information is of a timely nature. Investing in Open Markets involves a great deal of risk, including the loss of all or a portion of your investment, as well as emotional distress. All risks, losses and costs associated with investing, including total loss of principal, are your responsibility. The views and opinions expressed in this article are those of the authors and do not necessarily reflect the official policy or position of FXStreet nor its advertisers. The author will not be held responsible for information that is found at the end of links posted on this page.
If not otherwise explicitly mentioned in the body of the article, at the time of writing, the author has no position in any stock mentioned in this article and no business relationship with any company mentioned. The author has not received compensation for writing this article, other than from FXStreet.
FXStreet and the author do not provide personalized recommendations. The author makes no representations as to the accuracy, completeness, or suitability of this information. FXStreet and the author will not be liable for any errors, omissions or any losses, injuries or damages arising from this information and its display or use. Errors and omissions excepted.
The author and FXStreet are not registered investment advisors and nothing in this article is intended to be investment advice.