USD/JPY Price Forecast: Records back-to-back days of gains, stays below 144.00

- USD/JPY on track for a positive weekly close, yet still under key resistances, maintaining the downtrend.
- Resistance challenges include Kijun-Sen at 144.40 and Ichimoku Cloud; 50-DMA approaching a bearish cross with 100 and 200-DMAs.
- Buyer momentum builds with RSI rising, though remains below the critical 60 mark needed to overturn the downtrend.
- Potential upside targets 145.00 and the September 3 high at 147.21; a drop below 143.00 could test support at 142.04 (Tenkan-Sen).
The USD/JPY registers gain for back-to-back days, yet it remains shy of decisively cracking the 144.00 figure despite registering a weekly high of 144.49. At the time of writing, the pair exchanged hands at 143.96, up by 0.93%.
USD/JPY Price Forecast: Technical outlook
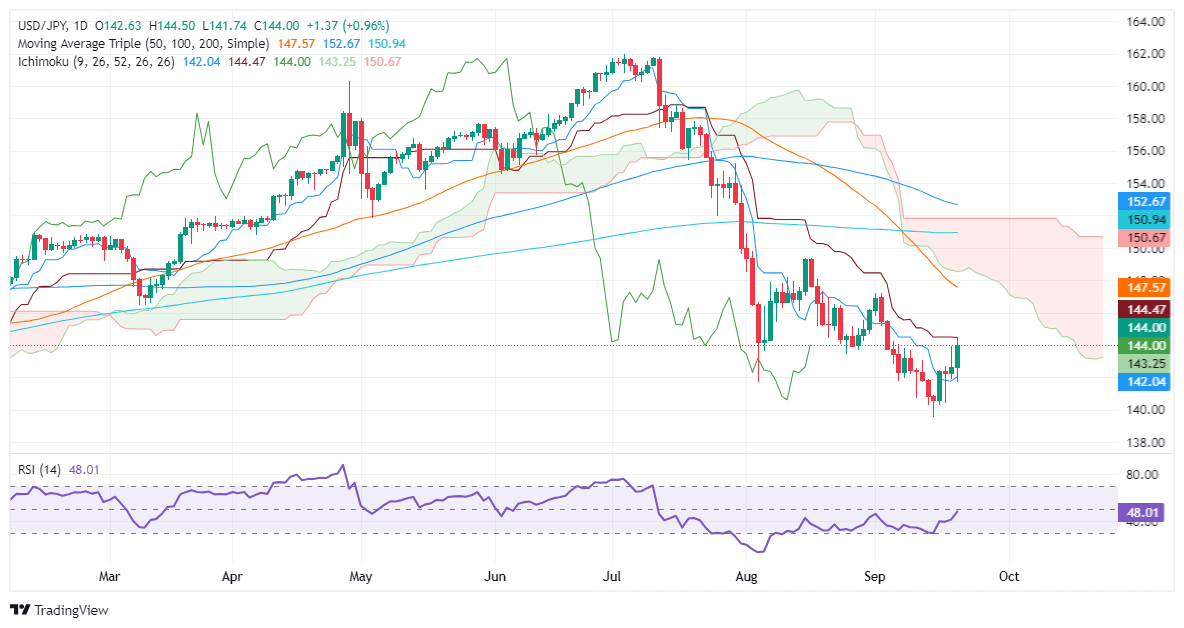
The pair is set to end the week positively, but the downtrend remains. The USD/JPY has failed to reclaim the Kijun-Sen at 144.46, and price action remains below the Ichimoku Cloud (Kumo).
In fact, the trend could accelerate as the 50-day moving average (DMA) crosses below the 100 and 200-DMAs, with the former closing the gap with the latter.
Momentum favors buyers as the Relative Strength Index (RSI) aims upward. However, it remains far from testing the 60 level, which is usually sought as a crucial break to change the USD/JPY ongoing downtrend.
Short-term, the USD/JPY could extend its gains, with the Kijun-Sen seen as first resistance at 144.40. A breach of the latter will expose the 145.00 figure, followed by the September 3 high at 147.21, followed by the 50-DMA at 147.56.
Conversely, if USD/JPY extends its losses past the 143.00 figure, the next support would be the Tenkan-Sen at 142.04.
USD/JPY Price Action – Daily Chart
Japanese Yen PRICE Today
The table below shows the percentage change of Japanese Yen (JPY) against listed major currencies today. Japanese Yen was the strongest against the Swiss Franc.
| USD | EUR | GBP | JPY | CAD | AUD | NZD | CHF | |
|---|---|---|---|---|---|---|---|---|
| USD | 0.02% | -0.23% | 0.95% | 0.07% | 0.13% | -0.02% | 0.31% | |
| EUR | -0.02% | -0.26% | 0.95% | 0.03% | 0.10% | -0.03% | 0.29% | |
| GBP | 0.23% | 0.26% | 1.21% | 0.31% | 0.38% | 0.24% | 0.58% | |
| JPY | -0.95% | -0.95% | -1.21% | -0.86% | -0.82% | -0.96% | -0.61% | |
| CAD | -0.07% | -0.03% | -0.31% | 0.86% | 0.05% | -0.08% | 0.26% | |
| AUD | -0.13% | -0.10% | -0.38% | 0.82% | -0.05% | -0.12% | 0.22% | |
| NZD | 0.02% | 0.03% | -0.24% | 0.96% | 0.08% | 0.12% | 0.34% | |
| CHF | -0.31% | -0.29% | -0.58% | 0.61% | -0.26% | -0.22% | -0.34% |
The heat map shows percentage changes of major currencies against each other. The base currency is picked from the left column, while the quote currency is picked from the top row. For example, if you pick the Japanese Yen from the left column and move along the horizontal line to the US Dollar, the percentage change displayed in the box will represent JPY (base)/USD (quote).
Information on these pages contains forward-looking statements that involve risks and uncertainties. Markets and instruments profiled on this page are for informational purposes only and should not in any way come across as a recommendation to buy or sell in these assets. You should do your own thorough research before making any investment decisions. FXStreet does not in any way guarantee that this information is free from mistakes, errors, or material misstatements. It also does not guarantee that this information is of a timely nature. Investing in Open Markets involves a great deal of risk, including the loss of all or a portion of your investment, as well as emotional distress. All risks, losses and costs associated with investing, including total loss of principal, are your responsibility. The views and opinions expressed in this article are those of the authors and do not necessarily reflect the official policy or position of FXStreet nor its advertisers. The author will not be held responsible for information that is found at the end of links posted on this page.
If not otherwise explicitly mentioned in the body of the article, at the time of writing, the author has no position in any stock mentioned in this article and no business relationship with any company mentioned. The author has not received compensation for writing this article, other than from FXStreet.
FXStreet and the author do not provide personalized recommendations. The author makes no representations as to the accuracy, completeness, or suitability of this information. FXStreet and the author will not be liable for any errors, omissions or any losses, injuries or damages arising from this information and its display or use. Errors and omissions excepted.
The author and FXStreet are not registered investment advisors and nothing in this article is intended to be investment advice.