Investors Double Down On Bitcoin And Ethereum Amid Market Dips! Here’s What To Expect From BTC And ETH Price Next


As we head toward the Bitcoin halving event, just a few days away, the market is experiencing a battle between the bulls and bears. Buyers are pushing hard to set a new all-time high for Bitcoin ahead of the event. Meanwhile, despite the presence of sellers at resistance levels, every dip in Bitcoin and Ethereum’s value is seeing eager accumulation, signaling a healthy market trend. Top analysts are forecasting an increase in buying activity leading up to the halving event, with a subsequent surge in BTC and ETH prices expected to follow.
Netflow Declines For BTC & ETH
Analysts have increasingly turned bullish toward Bitcoin and Ethereum as they show promising patterns despite continuous rejections from sellers. Matt Hougan, the Chief Investment Officer of crypto index fund manager Bitwise, recently highlighted the possibility of $1 trillion flowing into the bitcoin market through institutional investments in newly-launched spot bitcoin exchange-traded funds (ETFs).
Consequently, there’s a potential for Bitcoin’s value to exceed $100,000 and Ethereum’s to surpass $6,000 in the upcoming months. This has attracted investors to increase their holdings of BTC and ETH during price reductions, as highlighted by a key on-chain metric.
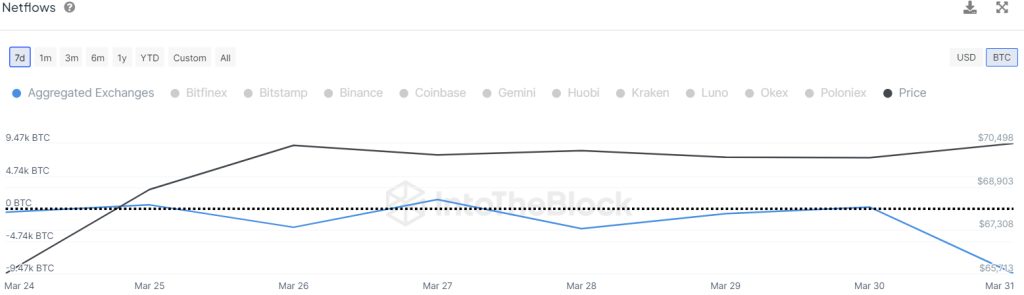
According to data from IntoTheBlock, the Bitcoin Netflow metric has seen a sharp decrease, currently standing at 9.47K BTC, indicating ongoing accumulation of BTC by investors even as prices fall. Similarly, Ethereum is experiencing significant accumulation, with its Netflow metric in the negative zone at 50K ETH, signifying that exchange reserves are declining, thereby reducing the likelihood of a price drop.
Bitcoin Price Analysis
Bitcoin has recently hovered within a tight range, oscillating between $72K and $68K, indicating a balance between buyers and sellers. However, bears have been trying hard to validate a downward trend below the support lines.
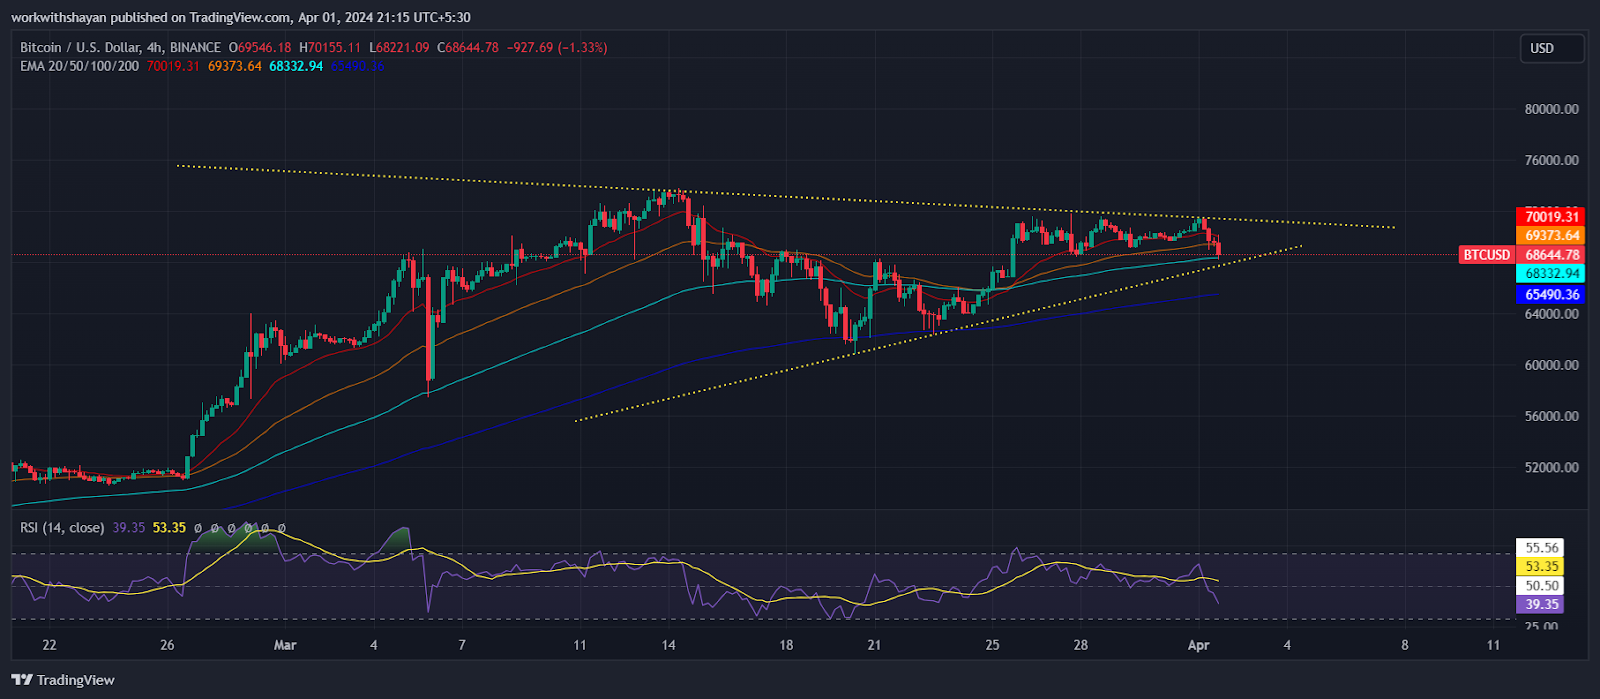
As BTC price recently broke below Fib levels, this indicates a rising bearish dominance on the price chart. This sentiment is supported by the declining trend of the 20-day exponential moving average (EMA) and the Relative Strength Index (RSI) heading toward the oversold region.
However, a surge above EMA lines will send the price to test $72K. This could trigger buyers to break the $74K level and create a new ATH near $80K.
Conversely, a downturn below the uptrend line might indicate profit-taking by buyers, potentially causing the pair to decline towards the 50-day simple moving average (SMA) around $63K.
Ethereum (ETH) Price Analysis
Ether has been hovering close to the $3,400 support level, indicating a tight contest between buyers and sellers. However, as the price recently dropped below EMA trend lines, it strengthened sellers’ confidence.
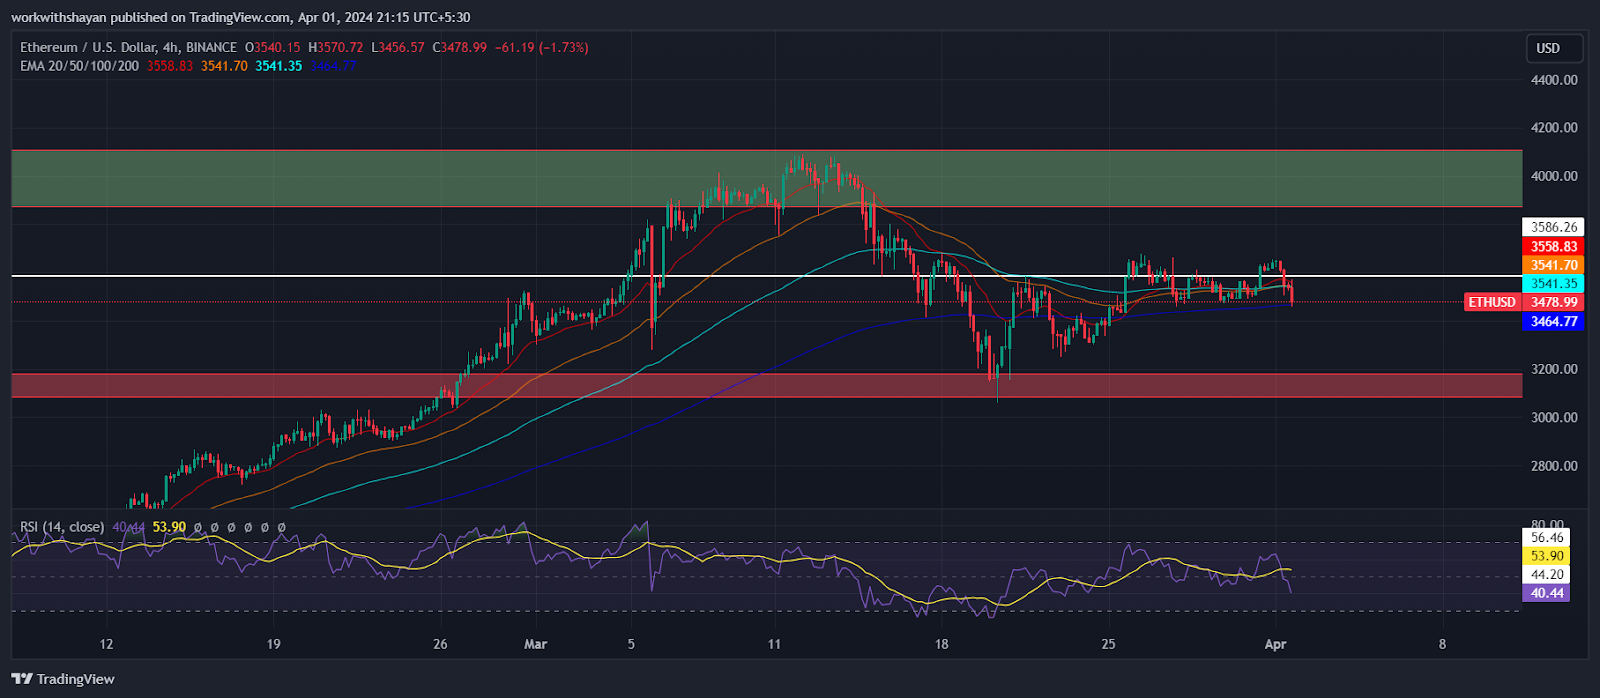
Should the price continue to drop and reach the support of $3,100, it will likely test buyers’ patience. A drop below this level will trigger a wave of selling pressure.
Conversely, a rebound from the current level or above $3,100 will push buying demand, resulting in a break above $3,650. This might send the price to consolidate around $4K.
Was this writing helpful?
No Yes

Shayan Chowdhury
Shayan is a digital nomad and a professional journalist. He delivers high-quality engaging articles to Coinpedia through his in-depth research and analysis.