
- Amazon stock trails 2% lower on Friday after Q4 beat.
- Q1 guidance for net sales, operating income failed to impress.
- Q4 EPS of $1.86 beat consensus by a sizable 38 cents.
- January US Nonfarm Payrolls came in well below expectations.
Amazon (AMZN) stock tripped over 2% lower on Friday following fourth-quarter results released late Thursday. The ecommerce and data hyperscaler beat expectations for the quarter, but Wall Street dismissed the result on account of conservative guidance for Q1.
Additionally, Amazon’s management expects a drastic headwind based on exchange rates.
The wider market is more optimistic at the end of the week as Nonfarm Payrolls (NFP) for January slumped, leading to the earlier possibility of Federal Reserve (Fed) rate cuts. The market still expects the central bank to hold rates flat at the March meeting, but the NFP of 143K new hires in January, well below the expectation of 170K, means heads are at least turning. The Unemployment Rate, however, threw a wrench in the mix by falling slightly to 4.0%.
The Dow Jones Industrial Average (DJIA), which includes Amazon as a constituent, opened slightly lower but not by much, while the S&P 500 and NASDAQ both saw light gains.
Amazon stock earnings news
In the fourth quarter, Amazon earned $1.86 in GAAP EPS, which is about $0.38 ahead of Wall Street’s consensus. Likewise, revenue of $187.8 billion, up 11% YoY, arrived $560 million ahead of the average forecast.
The big worry seems to be Q1 guidance for the current quarter. Management expects net sales of between $151.5 billion and $155 billion, whereas analysts had estimated $158 billion.
What’s more, management foresees what it called an “unusually large” charge for currency exchange at $2.1 billion. They said this would cut into growth by at least 150 basis points.
Yet a third reason for dour faces was operating income. Q1 operating income was given a wide range between $14 billion and $18 billion. That midpoint, $16 billion, is just $1 billion above the same figure one year ago. Investors view it as a sign that management realizes its growth rate is stalling. The Q4 operating income grew 60% YoY compared to 2023, but the same figure in Q1 is expected to increase less than 7% YoY.
Amazon Web Services or AWS, its cloud segment, accounted for about half of operating income in Q4. AWS segment sales grew 19% YoY to $28.8 billion.
Additionally, fourth-quarter free cash flow rose 4% YoY but was down substantially from the second and third quarters of last year.
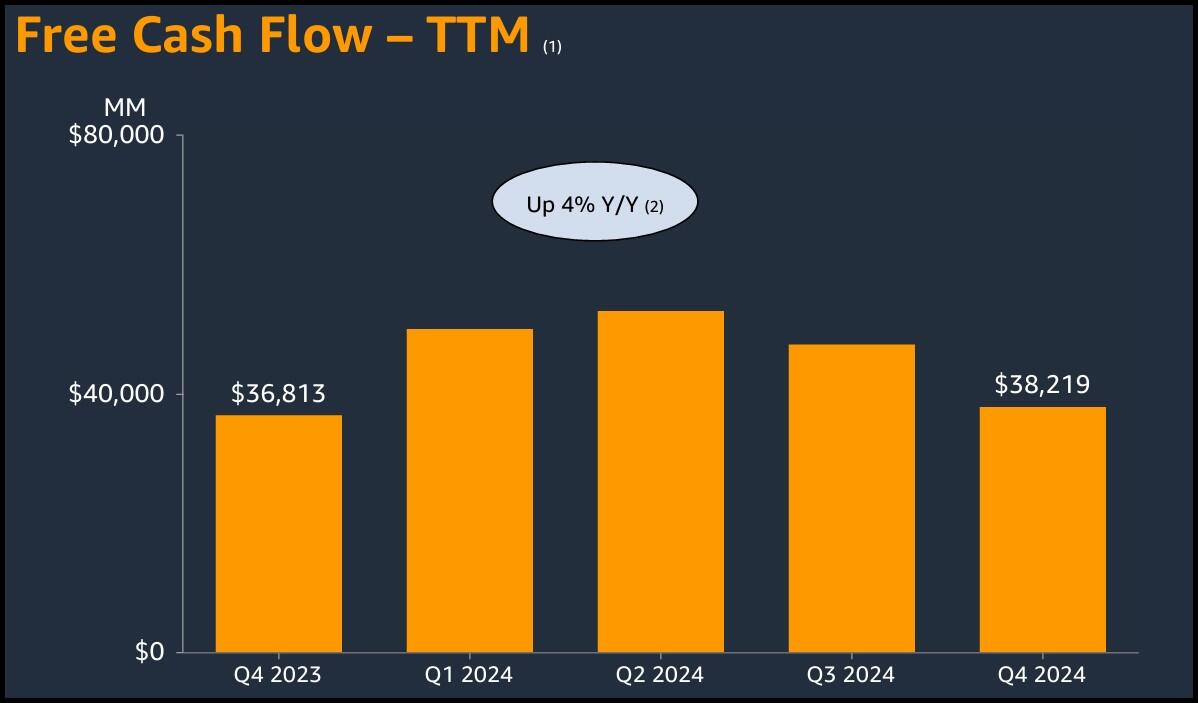
Amazon Q4 Earnings Presentation
Amazon stock forecast and chart
Amazon stock looks like it could use a pullback. The green trendlines on the daily chart below demonstrate a clear divergence between the Relative Strength Index (RSI) and the price chart. This type of divergence normally leads to a reversal.
Support sits at the January lows near $216.50 and the 100-day Simple Moving Average (SMA) at $210. A true correction would have AMZN stock drift down to the 200-day SMA near $196. If you think this is unlikely, just know that AMZN has tested the 200-day as recently as September before surging 40% higher over the next four months.
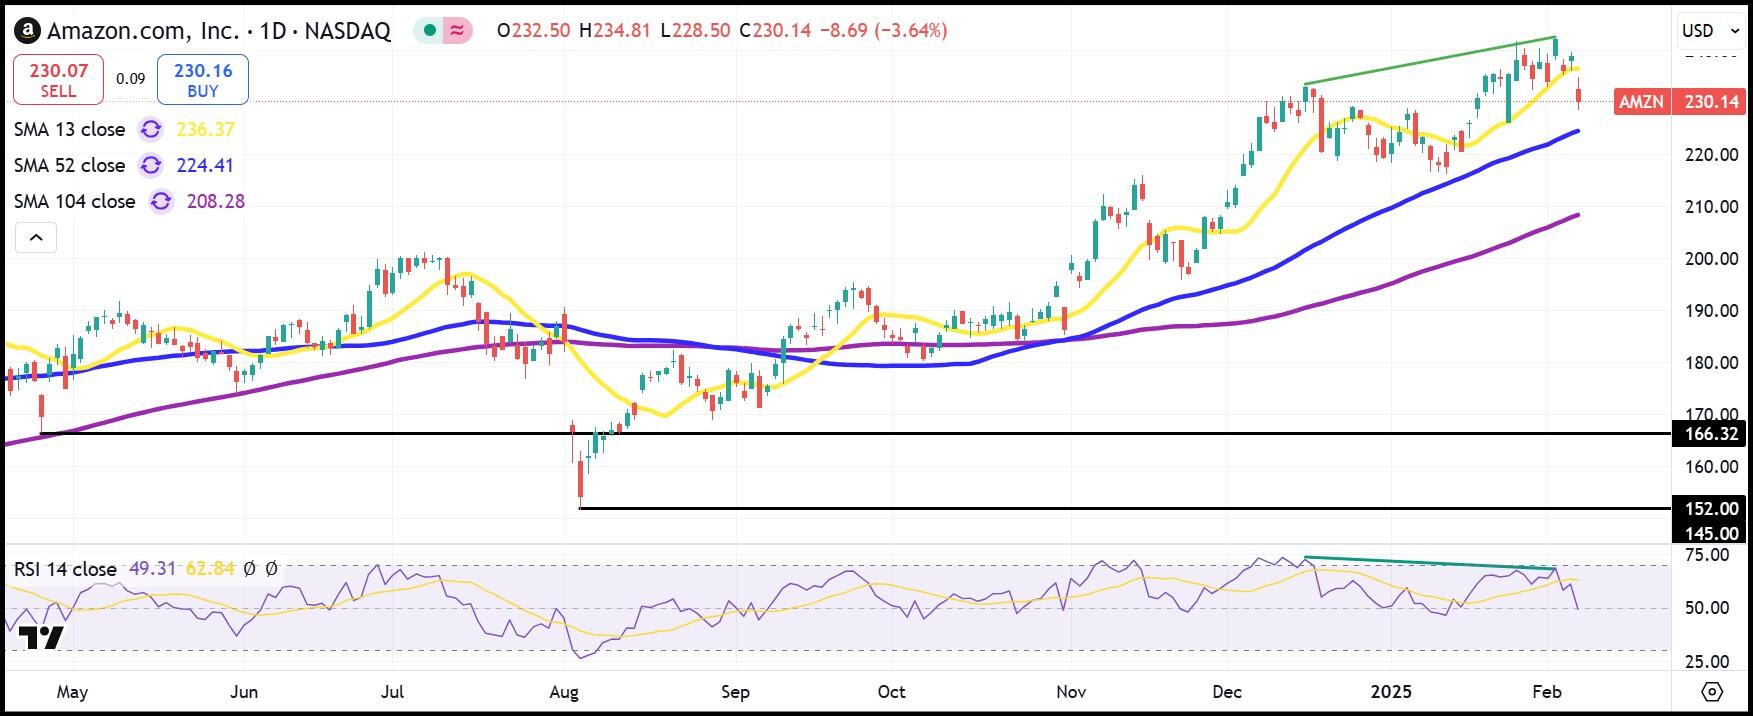
AMZN Daily Stock Chart
Information on these pages contains forward-looking statements that involve risks and uncertainties. Markets and instruments profiled on this page are for informational purposes only and should not in any way come across as a recommendation to buy or sell in these assets. You should do your own thorough research before making any investment decisions. FXStreet does not in any way guarantee that this information is free from mistakes, errors, or material misstatements. It also does not guarantee that this information is of a timely nature. Investing in Open Markets involves a great deal of risk, including the loss of all or a portion of your investment, as well as emotional distress. All risks, losses and costs associated with investing, including total loss of principal, are your responsibility. The views and opinions expressed in this article are those of the authors and do not necessarily reflect the official policy or position of FXStreet nor its advertisers. The author will not be held responsible for information that is found at the end of links posted on this page.
If not otherwise explicitly mentioned in the body of the article, at the time of writing, the author has no position in any stock mentioned in this article and no business relationship with any company mentioned. The author has not received compensation for writing this article, other than from FXStreet.
FXStreet and the author do not provide personalized recommendations. The author makes no representations as to the accuracy, completeness, or suitability of this information. FXStreet and the author will not be liable for any errors, omissions or any losses, injuries or damages arising from this information and its display or use. Errors and omissions excepted.
The author and FXStreet are not registered investment advisors and nothing in this article is intended to be investment advice.