Canada CPI set to show abating inflation pressure, setting stage for more rate cuts

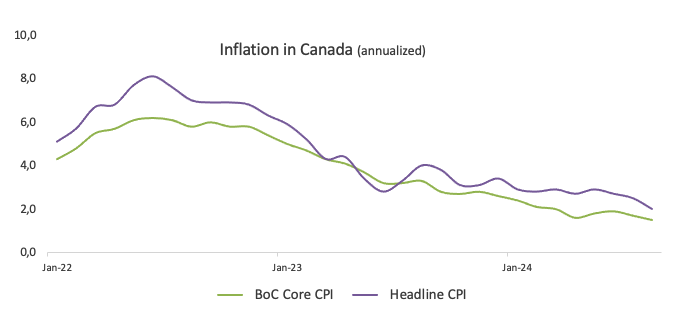
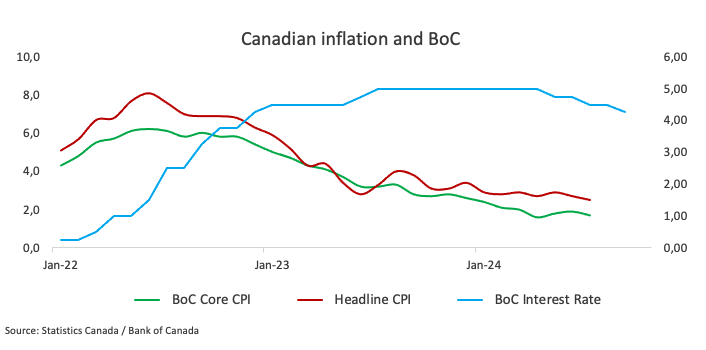
A report from Statistics Canada released on Tuesday revealed that annual inflation in Canada, as measured by the Consumer Price Index (CPI), increased by 2.0% in August. This figure came in short of market expectations and represents a decrease from July’s 2.5% rise.
On a monthly basis, the core CPI, which excludes the often fluctuating prices of food and energy, rose by 0.1%, while the headline CPI contracted by 0.2%. Additionally, the Bank of Canada’s Core Consumer Price Index saw a 1.5% annual increase, down from the 1.7% growth recorded in July.
Market reaction
USD/CAD navigates the upper end of the ongoing range just above the 1.3600 mark in the wake of the Canadian inflation figures.
Canadian Dollar PRICE Today
The table below shows the percentage change of Canadian Dollar (CAD) against listed major currencies today. Canadian Dollar was the strongest against the Japanese Yen.
| USD | EUR | GBP | JPY | CAD | AUD | NZD | CHF | |
|---|---|---|---|---|---|---|---|---|
| USD | 0.07% | 0.10% | 0.34% | 0.18% | 0.02% | 0.24% | 0.14% | |
| EUR | -0.07% | 0.02% | 0.24% | 0.07% | -0.07% | 0.16% | 0.07% | |
| GBP | -0.10% | -0.02% | 0.22% | 0.09% | -0.09% | 0.15% | 0.03% | |
| JPY | -0.34% | -0.24% | -0.22% | -0.13% | -0.28% | -0.06% | -0.18% | |
| CAD | -0.18% | -0.07% | -0.09% | 0.13% | -0.16% | 0.07% | -0.05% | |
| AUD | -0.02% | 0.07% | 0.09% | 0.28% | 0.16% | 0.22% | 0.10% | |
| NZD | -0.24% | -0.16% | -0.15% | 0.06% | -0.07% | -0.22% | -0.12% | |
| CHF | -0.14% | -0.07% | -0.03% | 0.18% | 0.05% | -0.10% | 0.12% |
The heat map shows percentage changes of major currencies against each other. The base currency is picked from the left column, while the quote currency is picked from the top row. For example, if you pick the Canadian Dollar from the left column and move along the horizontal line to the US Dollar, the percentage change displayed in the box will represent CAD (base)/USD (quote).
This section below was published as a preview of the Canadian inflation report for August at 08:00 GMT.
- The Canadian Consumer Price Index is expected to lose further traction in August.
- The Bank of Canada has reduced its policy rate by 75 bps so far this year.
- The Canadian Dollar seems to have embarked on a consolidative phase.
Canada is set to release the latest inflation data on Tuesday, with Statistics Canada publishing the Consumer Price Index (CPI) figures for July. Projections indicate a continuation of disinflationary trends in both the headline and the core CPI.
In addition to the headline CPI data, the Bank of Canada (BoC) will release its core CPI, which excludes volatile items such as food and energy. In July, the BoC’s core CPI showed a 0.3% gain from July and a 1.7% increase over the past year. Meanwhile, the headline CPI rose by 2.5% over the last 12 months, the lowest level in the last 40 months and 0.4% from a month earlier.
These figures are being closely watched, as they could affect the Canadian Dollar (CAD) in the near term via the Bank of Canada’s monetary policy, particularly following the central bank’s additional 25-basis-point cut to its policy rate earlier in the month, bringing it to 4.25%.
In the FX market, the Canadian Dollar remains sidelined below 1.3600, a region also coincident with the key 200-day SMA. The ongoing rangebound theme follows monthly peaks in the 1.3625-1.3620 band recorded on September 11.
What can we expect from Canada’s inflation rate?
Analysts expect price pressure in Canada to continue their downward trend in August, although they are still likely to remain above the Bank of Canada’s target. However, the persistence of disinflationary pressure should lead the BoC to maintain its easing cycle unchanged at its upcoming meetings. It is worth recalling that the central bank has already lowered its interest rate by 75 bps since it started its easing cycle earlier in the year.
Following the BoC’s rate cut on September 4, Governor Tiff Macklem noted that a 25 bps rate cut was appropriate, although a larger rate cut could be considered in case the economy was weaker than expected.
Regarding inflation, BoC Governor Tiff Macklem argued in a speech to the Canada-UK Chamber of Commerce in London on September 10 that global trade disruptions could make it more challenging for the central bank to consistently achieve its 2% inflation target. He explained that the BoC would need to balance the risks of controlling rising prices while supporting economic growth.
Macklem noted that with globalization slowing down, the cost of global goods might not decrease as much as before, potentially leading to increased upward pressure on inflation. He mentioned that “trade disruptions may also increase the variability of inflation,” pointing out the impact that supply shocks can have on prices. He added that such disruptions could result in “larger deviations of inflation from the 2% target.” Consequently, he said the Bank of Canada is focussing on risk management to balance inflation and economic growth and is investing in efforts to better understand global supply chains.
Analysts at TD Securities noted, “Base effects will contribute to a sharp (0.4pp) deceleration for headline CPI alongside further progress on core measures as softer energy prices and seasonal headwinds hold prices unchanged m/m”.
When is the Canada CPI data due, and how could it affect USD/CAD?
Canada is set to release its July CPI on Tuesday at 12:30 GMT. The Canadian Dollar’s reaction will largely depend on how the data impacts expectations for the Bank of Canada’s (BoC) monetary policy. Unless the figures contain significant surprises, the BoC is anticipated to maintain its current easing approach.
USD/CAD started the month with a decent upward bias, reaching monthly highs around 1.3620 last week. The monthly advance has so far been on the back of further depreciation of the Canadian currency, which has been losing momentum since the August tops near 1.3440 vs. the US Dollar (USD).
Pablo Piovano, a senior analyst at FXStreet, points out that USD/CAD appears well-supported around the critical 200-day Simple Moving Average (SMA) near 1.3590. A break below this level could trigger further weakness, potentially targeting the next support level at the August bottom of 1.3436 (August 28), just ahead of the March low of 1.3419 (March 8), and the weekly low of 1.3358 (January 31).
On the upside, Pablo notes that immediate resistance is located at the September peak of 1.3622 (September 11). The breakout of this region could expose provisional barriers at the 55-day and 100-day SMAs of 1.3659 and 1.3664, respectively, prior to the 2024 top of 1.3946 (August 5).
Pablo also mentioned that any significant increases in CAD volatility would likely hinge on unexpected CPI results. If inflation data comes in below expectations, it could strengthen the case for another BoC interest rate cut at the next meeting, potentially leading to a rise in USD/CAD. Conversely, if inflation exceeds expectations, the Canadian Dollar might experience only modest gains.
Economic Indicator
BoC Consumer Price Index Core (YoY)
The BoC Consumer Price Index Core, released by the Bank of Canada (BoC) on a monthly basis, represents changes in prices for Canadian consumers by comparing the cost of a fixed basket of goods and services. It is considered a measure of underlying inflation as it excludes eight of the most-volatile components: fruits, vegetables, gasoline, fuel oil, natural gas, mortgage interest, intercity transportation and tobacco products. The YoY reading compares prices in the reference month to the same month a year earlier. Generally, a high reading is seen as bullish for the Canadian Dollar (CAD), while a low reading is seen as bearish.
Last release: Tue Sep 17, 2024 12:30
Frequency: Monthly
Actual: 1.5%
Consensus: –
Previous: 1.7%
Source: Statistics Canada
Inflation FAQs
Inflation measures the rise in the price of a representative basket of goods and services. Headline inflation is usually expressed as a percentage change on a month-on-month (MoM) and year-on-year (YoY) basis. Core inflation excludes more volatile elements such as food and fuel which can fluctuate because of geopolitical and seasonal factors. Core inflation is the figure economists focus on and is the level targeted by central banks, which are mandated to keep inflation at a manageable level, usually around 2%.
The Consumer Price Index (CPI) measures the change in prices of a basket of goods and services over a period of time. It is usually expressed as a percentage change on a month-on-month (MoM) and year-on-year (YoY) basis. Core CPI is the figure targeted by central banks as it excludes volatile food and fuel inputs. When Core CPI rises above 2% it usually results in higher interest rates and vice versa when it falls below 2%. Since higher interest rates are positive for a currency, higher inflation usually results in a stronger currency. The opposite is true when inflation falls.
Although it may seem counter-intuitive, high inflation in a country pushes up the value of its currency and vice versa for lower inflation. This is because the central bank will normally raise interest rates to combat the higher inflation, which attract more global capital inflows from investors looking for a lucrative place to park their money.
Formerly, Gold was the asset investors turned to in times of high inflation because it preserved its value, and whilst investors will often still buy Gold for its safe-haven properties in times of extreme market turmoil, this is not the case most of the time. This is because when inflation is high, central banks will put up interest rates to combat it. Higher interest rates are negative for Gold because they increase the opportunity-cost of holding Gold vis-a-vis an interest-bearing asset or placing the money in a cash deposit account. On the flipside, lower inflation tends to be positive for Gold as it brings interest rates down, making the bright metal a more viable investment alternative.
Information on these pages contains forward-looking statements that involve risks and uncertainties. Markets and instruments profiled on this page are for informational purposes only and should not in any way come across as a recommendation to buy or sell in these assets. You should do your own thorough research before making any investment decisions. FXStreet does not in any way guarantee that this information is free from mistakes, errors, or material misstatements. It also does not guarantee that this information is of a timely nature. Investing in Open Markets involves a great deal of risk, including the loss of all or a portion of your investment, as well as emotional distress. All risks, losses and costs associated with investing, including total loss of principal, are your responsibility. The views and opinions expressed in this article are those of the authors and do not necessarily reflect the official policy or position of FXStreet nor its advertisers. The author will not be held responsible for information that is found at the end of links posted on this page.
If not otherwise explicitly mentioned in the body of the article, at the time of writing, the author has no position in any stock mentioned in this article and no business relationship with any company mentioned. The author has not received compensation for writing this article, other than from FXStreet.
FXStreet and the author do not provide personalized recommendations. The author makes no representations as to the accuracy, completeness, or suitability of this information. FXStreet and the author will not be liable for any errors, omissions or any losses, injuries or damages arising from this information and its display or use. Errors and omissions excepted.
The author and FXStreet are not registered investment advisors and nothing in this article is intended to be investment advice.


