Dow Jones Industrial Average sheds 330 points on Monday pullback

- The Dow Jones shed 330 points, or 0.8%, as equities retreat from record highs.
- Bullish momentum is taking a breather, with the Dow Jones bearing the brunt of the load.
- Earnings season expectations are battling with elevated interest rate fears.
The Dow Jones Industrial Average (DJIA) backslid on Monday, tumbling 330 points and shedding eight-tenths of one percent as equity markets ease back from recent record highs. The Dow bore most of the bearish burden to kick off the new trading week, with losses consolidated largely within the major equity index.
Bond yields ticked higher and construction stocks swooned on the day, with fresh fears across the broader market that the Federal Reserve (Fed) would be forced to keep interest rates higher for longer. Despite delivering a jumbo rate cut of 50 bps in September, investors are balking at the fact that the US economy remains stubbornly resilient, implying it could take the Fed even longer than expected to finally drag core inflation down to the 2% annual target.
Earnings season is in full swing in equity markets, with roughly a fifth of the companies listed on the S&P 500 set to release Q3 revenue reporting through this week. A little under 20% of S&P 500 companies already reported third-quarter earnings last week, with nearly 80% of reporting companies beating Wall Street expectations. However, analysts have noted that the extreme beats come off the back of significantly downgraded expectations in recent months; with investing markets expecting so little, it’s difficult for firms to fail, with CFRA chief investment strategist Sam Stovall noting, “rarely does anybody injure themselves falling out of a basement window.”
Dow Jones news
Most of the securities listed on the Dow Jones are easing back on Monday, with all but five of the Dow’s constituent stocks seeing red for the day. Boeing (BA) rose over 3% to hit $160 per share ahead of the airline company’s earnings call slated for Wednesday, October 23. On the low side, American Express (AXP), Home Depot (HD), and Travelers Companies (TRV) lead the loser, with each decline over 2%. AXP fell 2.5% to $270 per share, with HD shedding 2.3% and falling below $405.50, and Travelers Companies declining 2.25%, falling below $260 per share in the process.
Dow Jones price forecast
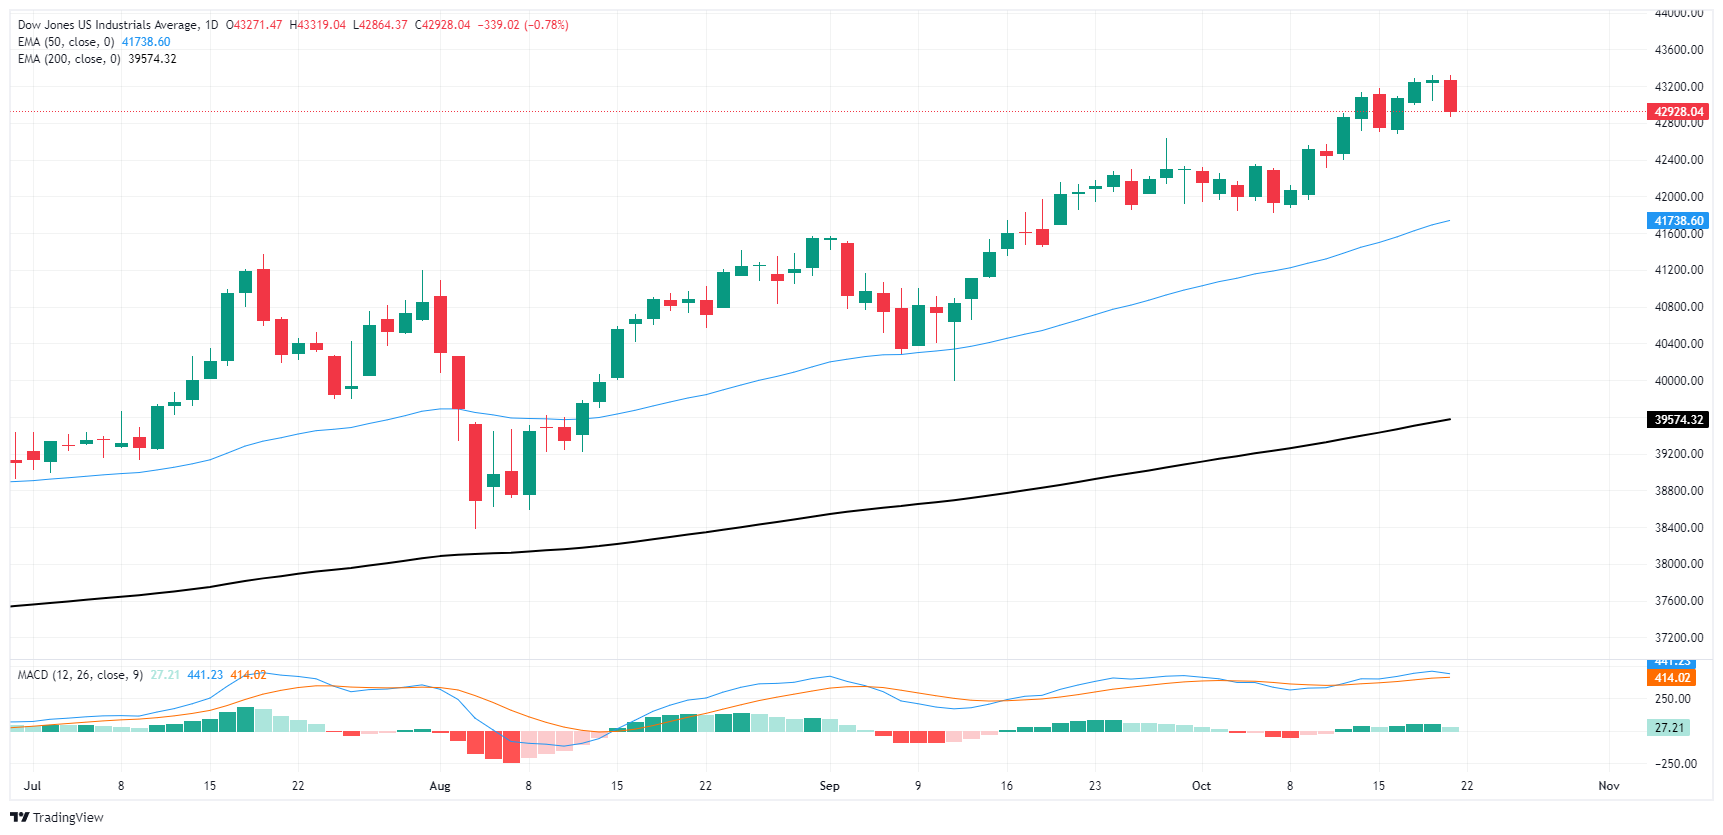
The Dow Jones is giving mixed signals on daily candlesticks. Price action continues to grind deeper into bull country as bidding momentum outpaces long-term moving averages. However, technical indicators are going on the fritz after spending months flashing warning signs of overbought conditions.
The Dow backpedaled from a recent record high north of 43,200 set last Friday, testing back below 43,000 and shedding over 300 points. Despite the pullback, prices are pinned firmly on the high side, with the 50-day Exponential Moving Average (EMA) well below near-term price action at 41,740.
The Moving Average Convergence-Divergence (MACD) is currently above the zero line, a bullish signal, but the histogram shows a declining momentum. The fast MACD line is now close to crossing below the slower signal line, signaling that bearish momentum could soon take over. This could point to a short-term correction, especially if sellers manage to push the price below the 42,000 level.
Nonetheless, the MACD remains in positive territory with no decisive crossover observed yet, indicating that bulls still maintain some control. However, traders should monitor this indicator closely for additional confirmation of a possible bearish reversal.
Dow Jones daily chart
Economic Indicator
Information on these pages contains forward-looking statements that involve risks and uncertainties. Markets and instruments profiled on this page are for informational purposes only and should not in any way come across as a recommendation to buy or sell in these assets. You should do your own thorough research before making any investment decisions. FXStreet does not in any way guarantee that this information is free from mistakes, errors, or material misstatements. It also does not guarantee that this information is of a timely nature. Investing in Open Markets involves a great deal of risk, including the loss of all or a portion of your investment, as well as emotional distress. All risks, losses and costs associated with investing, including total loss of principal, are your responsibility. The views and opinions expressed in this article are those of the authors and do not necessarily reflect the official policy or position of FXStreet nor its advertisers. The author will not be held responsible for information that is found at the end of links posted on this page.
If not otherwise explicitly mentioned in the body of the article, at the time of writing, the author has no position in any stock mentioned in this article and no business relationship with any company mentioned. The author has not received compensation for writing this article, other than from FXStreet.
FXStreet and the author do not provide personalized recommendations. The author makes no representations as to the accuracy, completeness, or suitability of this information. FXStreet and the author will not be liable for any errors, omissions or any losses, injuries or damages arising from this information and its display or use. Errors and omissions excepted.
The author and FXStreet are not registered investment advisors and nothing in this article is intended to be investment advice.


