Gold Price Forecast: XAU/USD trades mildly lower and closes a losing week after US PCE figures

- The XAU/USD experiences a slight decrease, holding slightly above $2,018 with a minor pullback.
- Key indicators such as RSI and MACD demonstrate a subdued buying momentum, as bulls consolidate December’s rally.
On Friday’s session, the XAU/USD was seen trading at $2,018, presenting a slight decline of 0.08% and closing a 0.55% weekly loss. After reaching a level of $2,135 in December, buyers have been largely taking a pause, suggesting a neutral to a bullish outlook on the daily chart. Despite some momentum observed in the four-hour chart, the indicators remain relatively weak.
In addition, the USD recovery fueled by markets adjusting their bets on the Federal Reserve (Fed) due to the US economy showing resilience is pushing the metal lower. On Friday, soft Personal Consumption Expenditures (PCE) figures from December from the US didn’t fuel a significant reaction to the market expectations on the Fed which meets next week. As for now, markets pushed the start of the easing cycle to May from March but the Fed’s tone may change those expectations.
XAU/USD levels to watch
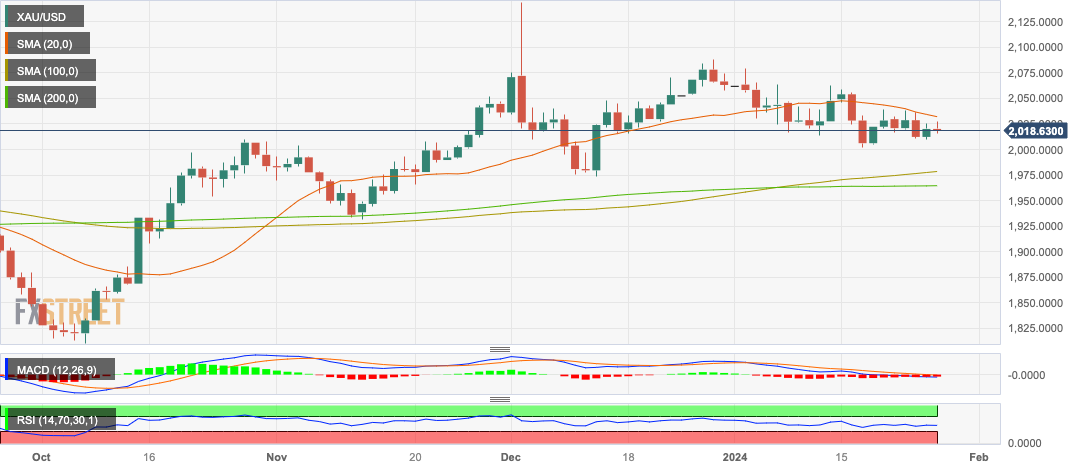
The technical indicators on the daily chart, specifically the Relative Strength Index (RSI) and the position of the metal regarding its 20, 100, and 200 Simple Moving Averages (SMAs) paint a diverse picture. Despite the RSI showing a negative slope and currently residing in negative territory, the price manages to stay above the 20, 100, and 200-day SMAs. This is indicative of bullish standing in the broader time frame, and the recent pullback could be explained by the bulls taking a breather after pushing the price to a high of $2,135 in December.
Drilling down to the narrower four-hour chart, the momentum indicators present weak yet existent bullish undertones. The four-hour RSI shows a negative slope but is currently in positive territory, while the four-hour Moving Average Convergence Divergence (MACD) continues to produce flat red bars, again suggesting a hold on bearish momentum.
XAU/USD daily chart
Information on these pages contains forward-looking statements that involve risks and uncertainties. Markets and instruments profiled on this page are for informational purposes only and should not in any way come across as a recommendation to buy or sell in these assets. You should do your own thorough research before making any investment decisions. FXStreet does not in any way guarantee that this information is free from mistakes, errors, or material misstatements. It also does not guarantee that this information is of a timely nature. Investing in Open Markets involves a great deal of risk, including the loss of all or a portion of your investment, as well as emotional distress. All risks, losses and costs associated with investing, including total loss of principal, are your responsibility. The views and opinions expressed in this article are those of the authors and do not necessarily reflect the official policy or position of FXStreet nor its advertisers. The author will not be held responsible for information that is found at the end of links posted on this page.
If not otherwise explicitly mentioned in the body of the article, at the time of writing, the author has no position in any stock mentioned in this article and no business relationship with any company mentioned. The author has not received compensation for writing this article, other than from FXStreet.
FXStreet and the author do not provide personalized recommendations. The author makes no representations as to the accuracy, completeness, or suitability of this information. FXStreet and the author will not be liable for any errors, omissions or any losses, injuries or damages arising from this information and its display or use. Errors and omissions excepted.
The author and FXStreet are not registered investment advisors and nothing in this article is intended to be investment advice.