In the first year of the Fran Brown era at Syracuse, the Orange won ten games for the first time since 2018 and had one of the nation’s best passing offenses in 2024.
Much of that success came from Kyle McCord, who transferred from Ohio State ahead of the 2024 season. With McCord now gone, Brown has named Notre Dame transfer Steve Angeli as the new starter, and the young quarterback recently shared what helped him win the job at Syracuse.
Steve Angeli Shares the Traits That Earned Him Syracuse’s Starting QB Job
Brown took over the Syracuse football program in November 2023 and immediately established a new culture. He introduced two mottos that define the team’s approach: DART, which stands for ‘Detailed, Accountable, Relentless, Tough, and CCT, which stands for care, commitment, and trust.
Angeli transferred to Syracuse this spring to compete for the starting quarterback job against LSU transfer Rickie Collins and was officially named the starter today.
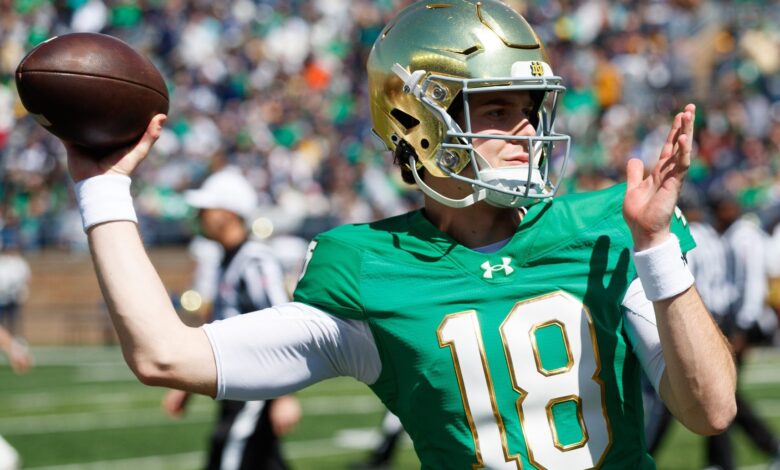
Sources: Syracuse has named Notre Dame transfer Steve Angeli the starting quarterback, and he’ll debut for the Orange against No. 24 Tennessee in the opener in Atlanta. Angeli, a redshirt junior, narrowly beat out LSU transfer Rickie Collins, who played well during camp. pic.twitter.com/ax2mgUOEkm
— Pete Thamel (@PeteThamel) August 18, 2025
On August 12, 2025, Angeli was asked how he’s handling the pressure of the quarterback competition and what separates him from others. He pointed to both DART and CCT, crediting Brown’s mottos for shaping him not only into a better player but also into a stronger leader on and off the field.
“Yeah, I think I’m a leader in all aspects of my life,” Angeli said. “You know, what [Fran Brown] says is, you know, he wants someone that’s DART in CCT, you know, and not just on the football field, but throughout their whole life. I’m really trying to embrace that and continuing to do that.”
Now that Angeli has officially won the quarterback battle, he steps into big shoes after Syracuse fielded one of the most prolific passing attacks in the country last season. In 2024, McCord led the nation with 4,779 passing yards and added 34 touchdowns.
Angeli, a composite four-star recruit in the class of 2022, originally committed to Notre Dame. In three seasons with the Fighting Irish, he totaled 772 passing yards, 10 touchdowns, and just one interception.
Read More: Syracuse Shakeup: Orange HC Fran Brown Sends Clear Message to QBs With Steve Angeli Signing
The 2025 season will be his first as a college starter. If he continues to embrace Brown’s mantras, he has the chance to thrive in Syracuse’s offense both through his play on the field and his role as a leader in the locker room.
Angeli will face a major test right away as the Orange open the season against SEC powerhouse Tennessee on Saturday, August 30, at Mercedes-Benz Stadium in Atlanta, Georgia.