Halle Berry’s Ex-Husband, David Justice, Blames Breakup On Berry Not Seeming, “Like, Motherly”
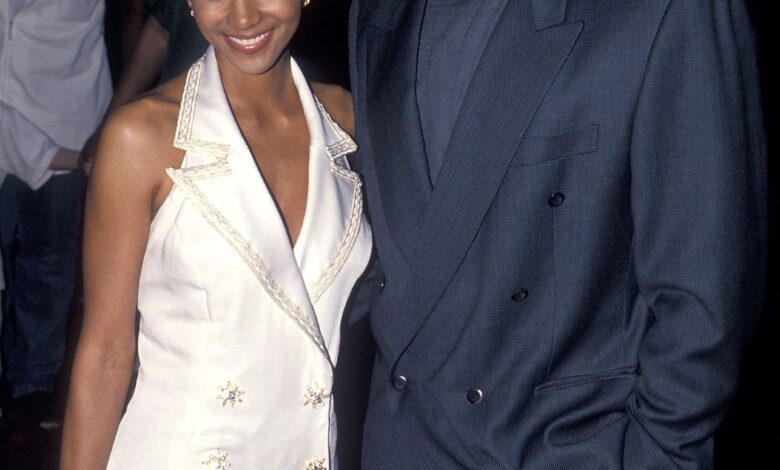
David Justice, ex-husband of Oscar winner Halle Berry, evidently had a few things to get off his chest about their relationship. The 59-year-old former baseball player, who was married to the actor from 1993 to 1997, spoke of his time with Berry during a recent guest appearance on Matt Barnes’ podcast, All the Smoke.
Problems arose five months in, he said, when the honeymoon phase ended and the athlete began thinking about starting a family. “My knowledge and understanding, as well as my wisdom around relationships, just wasn’t vast,” he said. “I’m looking at my mom, and I’m a Midwest guy, so in my mind I’m thinking a wife at that time should cook, clean—traditional, you know?” The next question dawned on him naturally: “Okay, if we have kids, is this the woman I want to have kids with and build a family with?” The answer soon came to him: “At that time, as a young guy, she don’t cook, don’t clean, don’t really seem, like, motherly. And then we started having issues,” he recalls.
For the record, today Berry has a 19-year-old daughter, Nahla Ariela, born of her prior relationship with 48-year-old Canadian model Gabriel Aubry. After Justice, she married—and divorced—twice more, first wedding singer Eric Benet and then French actor Olivier Martinez. Her second son, Maceo Robert, was born during the latter union.
Since 2020, Berry has been going steady with singer-songwriter Van Hunt, whom she often refers to as “my man” and the person who makes her feel most complete. He proposed earlier this summer, but Berry has not yet given him an answer, commenting, as reported by People, that Van also has a divorce behind him, so “we don’t have to get married to make our love meaningful. We really don’t.”
The situation with Justice was the opposite, according to the sportsman. “She asked me to marry her after knowing me for five months. And I said okay, because I couldn’t say no. I mean, who’s going to say no at that time?” Surprisingly, their relationship remained largely out of the spotlight until they announced their separation, mainly due to professional differences.
“I don’t know if my heart was really into it, but I didn’t want to make her feel bad and say no. Or I was just in the moment. It caught me off guard, but I was like cool, we’re getting along, we’re vibing,” Justice added. However, it did not last long: “We spent a lot of time apart because she was doing movies in this country, that country. We honestly probably could have made it if I knew about therapy.”
Today, Justice has three children—but apparently he has not put the past behind him. Berry, for her part, has always said she didn’t want to stay in a relationship for the wrong reasons. “I don’t want to keep the wrong man,” she told Drew Barrymore in February 2025. “I’m not crazy, right? So when you find that you make a mistake—we all make mistakes. We have a right to say, ‘Oh God, this was a mistake. Let me start again.’ We have the right to do that.”
This article was originally published in Vanity Fair Italia.