SwitchArcade Round-Up: ‘8-Colors Star Guardians +’, ‘Cosmo Gang The Puzzle’, Plus Other Releases and Sales
Hello gentle readers, and welcome to the SwitchArcade Round-Up for January 11th, 2024. It’s Thursday, and that means we have a whole bunch of new releases! What’s that? Hm. I see. Okay, I’ll try to work with it. It’s Thursday, and that means we have a few new releases! For whatever it’s worth, most of them look fine enough for what they’re trying to do. We’ve got summaries of all of them, plus the lists of new and expiring sales for the day. Surprisingly, it’s looking like tomorrow is going to be the big release day of this week. Let’s get into what we’ve got!
New Releases
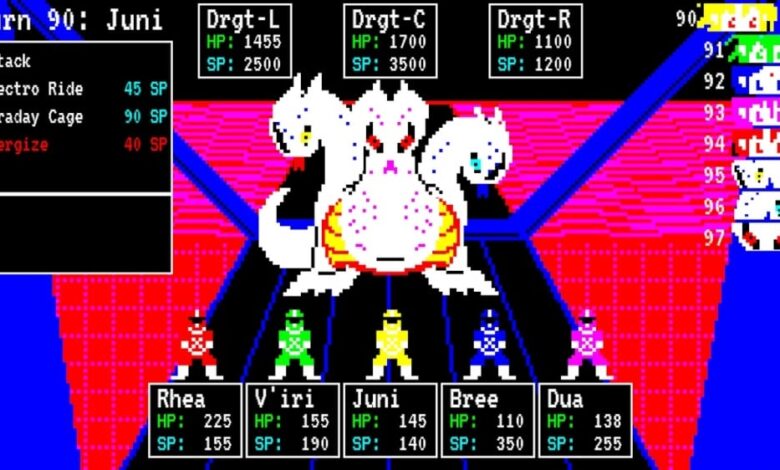
8-Colors Star Guardians + ($4.99)
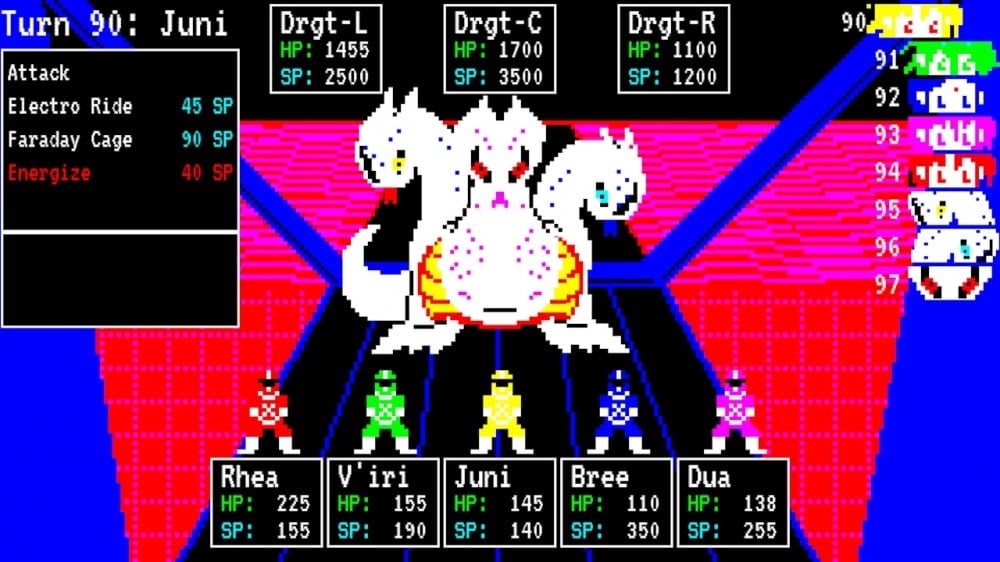
I really love how this game looks, but I’m having a hard time parsing how it plays. It seems like an RPG, but I suppose the idea is that you have to choose the correct path through the game’s eight bosses. Each boss you defeat will grant your characters new abilities that will equip them for taking down a specific other boss. Like if Mega Man was a command-based boss rush, I guess? I’m confident the vibe will carry it long enough for the gameplay to click for me, but we’ll see how it goes.
Wild Seas ($4.99)
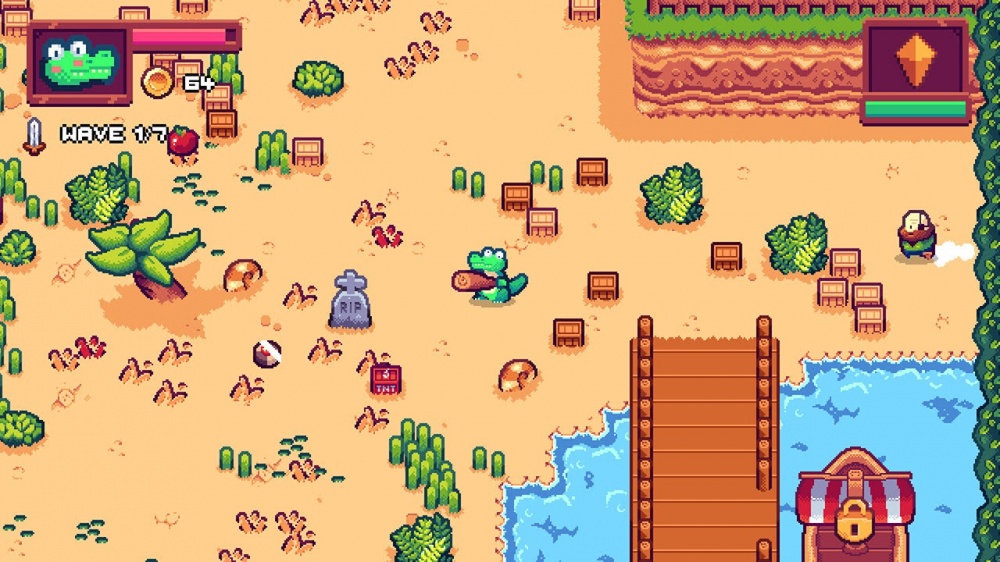
A colorful little tower defense game starring a crocodile with a staff who has to defend some islands against evil invading pirates who want to steal a magical jewel. Nothing too fancy or unusual here, but for what it is it seems more than fine.
Arcade Archives Cosmo Gang The Puzzle ($7.99)
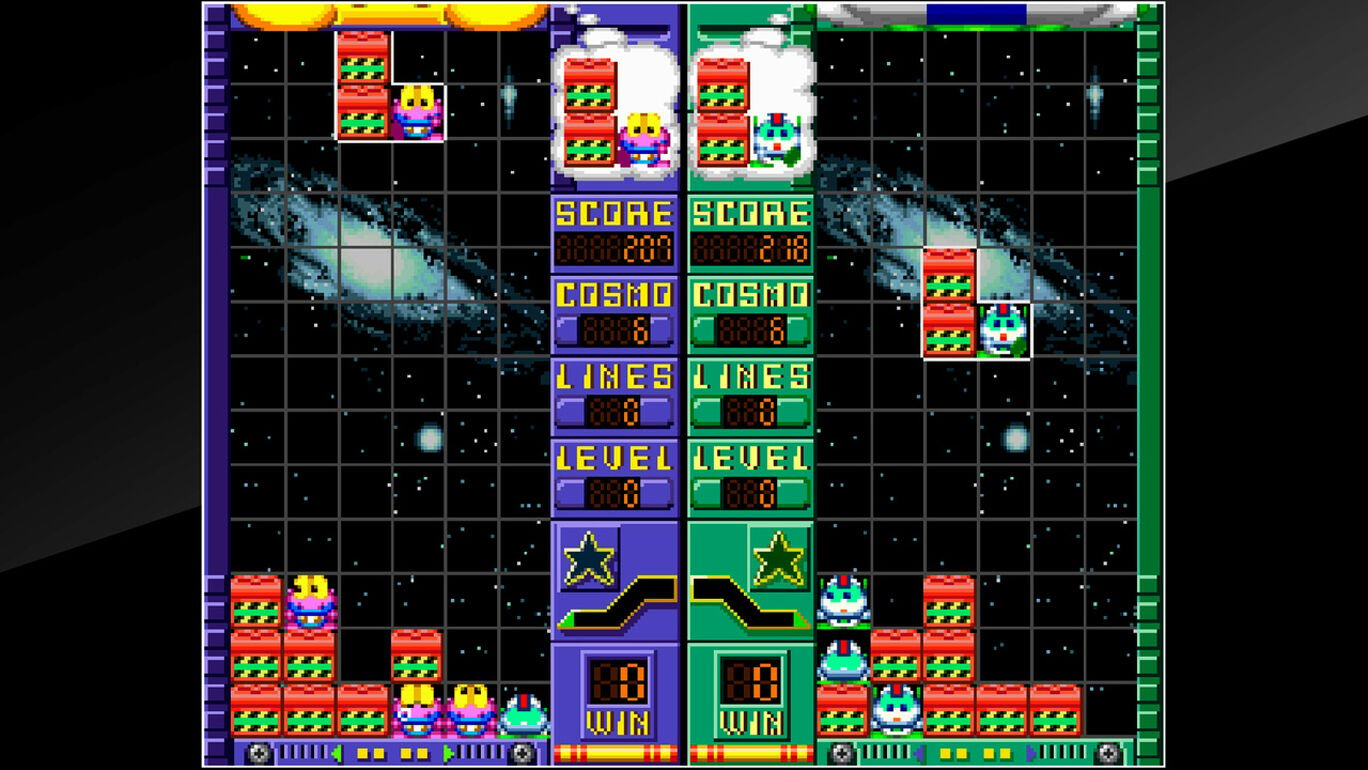
Some of you might know the game Pac-Attack or Pac-Panic, Namco’s Pac-Man flavored entry into the falling block puzzler market. What many of you may not know is that the game was a reskin of another title, and here it is. Cosmo Gang The Puzzle is based on a short-lived series of characters seen in some arcade prize games in Japan. We previously saw the Galaga-ish shooter based on them, and this is their other game. It is pretty much just like Pac-Attack/Panic, but with Cosmo Gang creatures in place of the ghosts and rather dull balls with arrows on them in place of Pac. A fun game, but it loses something without the Pac-Man paint.
nGolf ($21.99)
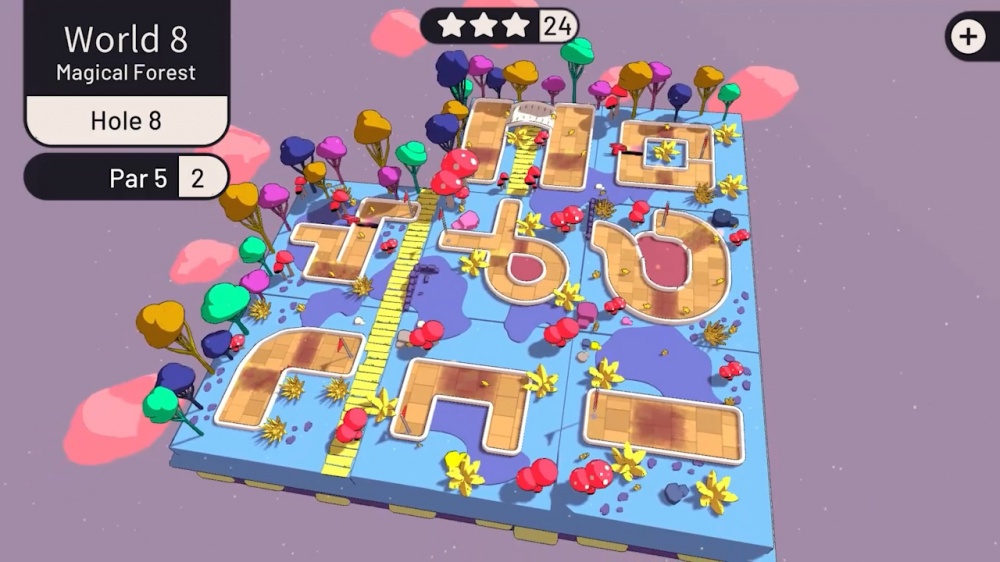
Just a basic mini-golf game, the kind we can see a fair number of already on the eShop for around five bucks. And since this is RedDeer, I’m pretty sure this will swiftly be discounted to that price point. You could just buy one of the normal five dollar mini-golf games instead of feeding this sleazy sales tactic, but I’m not here to tell you what you ought or ought not to do.
Sales
(North American eShop, US Prices)
That’s just a sad list, isn’t it? I have no notes about the inbox. In the outbox, the latest sale from Flynn’s Arcade is finishing up, and so are the sales on games like Don’t Starve and Mark of the Ninja. They will probably be back on sale again before too long, but if you think you’ll play them now, you know what you must do. At least treat yourself to Donut Dodo for a measly two and a half bucks.
Select New Sales

Lotus Reverie: First Nexus ($2.39 from $15.99 until 1/22)
Naught ($2.99 from $19.99 until 1/22)
The Savior’s Gang ($2.14 from $4.99 until 1/22)
Anima: Gate of Memories ($2.99 from $19.99 until 1/22)
Anima: GoM – Nameless Chronicles ($2.99 from $19.99 until 1/22)
Super Kotodama ($2.14 from $4.99 until 1/22)
Heart&Slash ($2.39 from $14.99 until 1/22)
Steamroll: Rustless Edition ($2.39 from $9.99 until 1/22)
Timothy vs the Aliens ($2.54 from $16.99 until 1/22)
Flying Soldiers ($2.69 from $17.99 until 1/22)
Get Ogre It ($2.15 from $11.99 until 1/22)
Sales Ending Tomorrow, January 12th

Airport Simulator: Day & Night ($6.99 from $34.99 until 1/12)
Colored Effects ($2.49 from $4.99 until 1/12)
Don’t Starve Together ($5.09 from $14.99 until 1/12)
Don’t Starve: Nintendo Switch Edition ($4.99 from $19.99 until 1/12)
Donut Dodo ($2.49 from $4.99 until 1/12)
Finding Paradise ($7.19 from $11.99 until 1/12)
Firefighters: Airport Fire Department ($7.99 from $39.99 until 1/12)
Firefighters: Airport Heroes ($7.99 from $39.99 until 1/12)
Firefighters: The Simulation ($7.99 from $39.99 until 1/12)
Forestry – The Simulation ($3.99 from $19.99 until 1/12)
Galacticon ($2.49 from $4.99 until 1/12)
Invisible Inc Console Edition ($4.99 from $19.99 until 1/12)
Joe’s Diner ($3.99 from $19.99 until 1/12)
Livestream 2 ($21.24 from $24.99 until 1/12)
Mark of the Ninja Remastered ($4.99 from $19.99 until 1/12)

Metro Simulator ($3.99 from $19.99 until 1/12)
Mountain Rescue Simulator ($7.99 from $39.99 until 1/12)
Murtop ($2.49 from $4.99 until 1/12)
Pineview Drive ($3.99 from $19.99 until 1/12)
Professional Construction The Simulation ($7.99 from $39.99 until 1/12)
Professional Farmer ($7.99 from $39.99 until 1/12)
Professional Farmer: American Dream ($7.99 from $39.99 until 1/12)
Sentry City ($2.49 from $4.99 until 1/12)
Space Blaze ($5.99 from $29.99 until 1/12)
The Shape of Things ($2.09 from $6.99 until 1/12)
TheNightfall ($7.99 from $39.99 until 1/12)
To The Moon ($7.19 from $11.99 until 1/12)
That’s all for today, friends. We’ll be back tomorrow with the remaining releases of the week, plus whatever sales and big news come in during the next day or so. I have to go to the fancy hospital tomorrow for a test, but I should be more or less in and out. As such, I think we won’t have any problem having an article for you all on time. I hope everyone has a thrilling Thursday, and as always, thanks for reading!