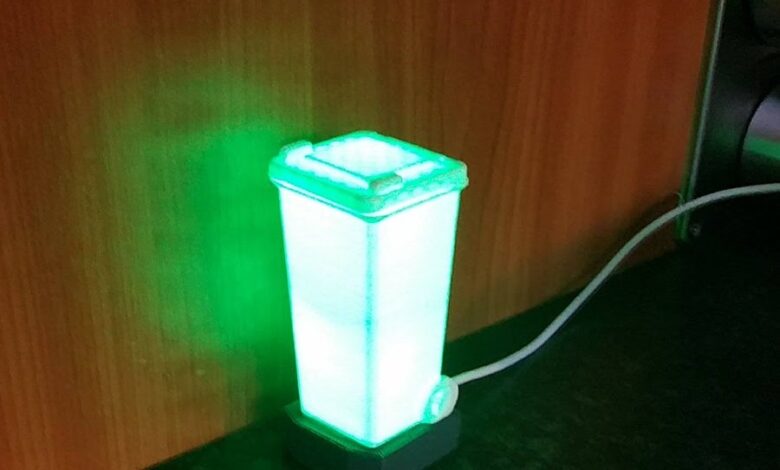
I Made a Rubbish Clock

With separate plastic, metal, paper, and glass recycling, composting, and pick up of all the rest, knowing which days to put out which bins can be complicated. Some have turned to high-tech solutions like Darren Tarbard’s wonderful “bindicator“.
There’s even a commercial version of that.
I thought about making something similar, but decided that a high-tech solution isn’t always the right one. Instead I made a clock, or rather a clock face. My rationale was as follows: the bin days don’t change frequently so no need to call an API to get them, and anyway most councils don’t have an API for this sort of thing. Also, I really didn’t want yet another thing with a wall wart, or WiFi to configure, or code to debug (there comes a time in every programmer’s life when they can’t face debugging yet another thing that should be simple and just work).
Not everything needs to be Turing Complete! But you can buy cheap clock mechanisms where the hands go full circle in seven days instead of 12 hours. Something like this.
So, I wrote a bunch of code to produce an SVG (and PDF and PNG) for the clock face. The code is here. You end up with something like this which can be printed.
The colours and wording are all determined by the schd and bins variables. The code should be easy to customize for your location’s schedule. It supports up to two different bin types per day. If you need more you’ll have to modify the code.
bins = {
“none”: [“white”, “”],
“lixo”: [“#72859E”, “Lixo”],
“papl”: [“#255FC9”, “Papel”],
“embl”: [“#DED044”, “Embalagens”],
}
days = [“Sun”, “Mon”, “Tues”, “Wednes”, “Thurs”, “Fri”, “Satur”]
schd = [[“none”],
[“lixo”],
[“papl”, “embl”],
[“lixo”],
[“papl”],
[“lixo”, “embl”],
[“papl”]]
There’s no need for you to use Portuguese; I have because I’m dealing with Portuguese rubbish collection.
The only interesting piece of code is the generation of the curves for the seven daily segments (and also for the curved wording). This is done by the function path:
def getXY(p, r, s):
a = 2.0 * math.pi * (p * pps + rot)
return s % (r * math.cos(a),
r * math.sin(a))
def path(p, r):
s = ” %.2f %.2f “
pa = “M”
pa += getXY(p, r, s)
pa += “A %.2f %.2f 0 0 1” % (r, r)
pa += getXY((p+1), r, s)
return pa
In SVG you can define a path element which can be used to make all sorts of curves, arcs, and lines. My path function takes two parameters: p is a number between zero and six representing the seven daily segments needed on the clock; r is the radius of the arc. The function uses getXY to find the position of a point on the arc. It does this twice to find the start and end point.
So, path ends up returning something like M x0 y0 A r r 0 0 1 x1 y1 where x0, y0, x1, y1 are the calculated end points of the arc and r is the radius of the arc. The M x0 y0 means “move to (x0, y0)” The A r r 0 0 1 x1 y1 means “draw an arc of radius r to the point (x1, y1)”. The 0 0 1 in the middle correspond to three parameters: x-axis-rotation, large-arc-flag, and sweep-flag; it’s best to refer to the documentation for those because they determine the direction in which the arc points and whether it is rotated.
The final part of the path SVG element, L 0 0, is added elsewhere in the code. It sets the centre of the arc at (0, 0). I used the viewBox attribute of the SVG to make the SVG geometry be between (-1, -1) and (1, 1) thus making the centre of the image (0, 0).
print(‘
Armed with a suitable printed clock face, I got a simple square picture frame, a few bits of wood for spacers, and put it all together into a “rubbish clock”.
 |


