
- Alibaba management approves another $25 billion worth of buybacks.
- BABA trades lower as profits fall from a year ago, revenue growth slows.
- Alibaba stock continues to trade about 75% off its 2020 high of $319.
- Retail sales have slowed nationwide in China as real estate bubble unwinds.
Alibaba (BABA), once the leading light among Chinese stocks owned by foreigners, hit yet another snag on Wednesday. China’s ecommerce leader reported another ho-hum earnings report, this time for the third fiscal quarter ending in December.
BABA stock sank 6% on Wednesday as adjusted earnings per American depository share (EPADS) printed at $2.67. This was slightly higher than consensus but beneath the $2.79 earned one year prior.
The S&P 500 contracted 0.85% on Wednesday, while the NASDAQ fell 1%.
Alibaba revenue of $36.67 billion rose a meager 5% YoY and underperformed some consensus estimates while beating others. Management seemed clear-eyed about the once dynamic company’s situation.
“Our top priority is to reignite the growth of our core businesses, e-commerce and cloud computing,” said Alibaba’s new CEO, Eddie Wu. “We will step up investment to improve users’ core experiences to drive growth in Taobao and Tmall Group and strengthen market leadership in the coming year.”
The company is in the process of splitting up into six distinct units, some of which are expected to eventually hold their own IPOs. Two of the most important segments, Cloud Intelligence and the Taobao & Tmall Group, grew their revenue just 3% and 2%, respectively, on an annual basis.
Diluted earnings per ADS, similar to GAAP results, came in at $0.80 in fiscal Q3. This fell from $1.49 in the previous quarter ending in September.
The domestic retail segment grew revenue just 1% YoY, but the much smaller domestic wholesale business saw sales rise 23%. Meanwhile, the International Digital Commerce segment, which manages Lazada, Alibaba.com and AliExpress, posted a 44% increase in annual revenue.
Interestingly, Alibaba’s board signed off on a $25 billion addition to its stock buyback policy, but the market panned the extremely large announcement. That buyback would reduce current shares outstanding by about 12.5%.
S&P 500 FAQs
What is the S&P 500?
The S&P 500 is a widely followed stock price index which measures the performance of 500 publicly owned companies, and is seen as a broad measure of the US stock market. Each company’s influence on the computation of the index is weighted based on market capitalization. This is calculated by multiplying the number of publicly traded shares of the company by the share price. The S&P 500 index has achieved impressive returns – $1.00 invested in 1970 would have yielded a return of almost $192.00 in 2022. The average annual return since its inception in 1957 has been 11.9%.
How are companies chosen to be included in the S&P 500?
Companies are selected by committee, unlike some other indexes where they are included based on set rules. Still, they must meet certain eligibility criteria, the most important of which is market capitalization, which must be greater than or equal to $12.7 billion. Other criteria include liquidity, domicile, public float, sector, financial viability, length of time publicly traded, and representation of the industries in the economy of the United States. The nine largest companies in the index account for 27.8% of the market capitalization of the index.
How can I trade the S&P 500?
There are a number of ways to trade the S&P 500. Most retail brokers and spread betting platforms allow traders to use Contracts for Difference (CFD) to place bets on the direction of the price. In addition, that can buy into Index, Mutual and Exchange Traded Funds (ETF) that track the price of the S&P 500. The most liquid of the ETFs is State Street Corporation’s SPY. The Chicago Mercantile Exchange (CME) offers futures contracts in the index and the Chicago Board of Options (CMOE) offers options as well as ETFs, inverse ETFs and leveraged ETFs.
What factors drive the S&P 500?
Many different factors drive the S&P 500 but mainly it is the aggregate performance of the component companies revealed in their quarterly and annual company earnings reports. US and global macroeconomic data also contributes as it impacts on investor sentiment, which if positive drives gains. The level of interest rates, set by the Federal Reserve (Fed), also influences the S&P 500 as it affects the cost of credit, on which many corporations are heavily reliant. Therefore, inflation can be a major driver as well as other metrics which impact the Fed decisions.
Alibaba stock forecast
Alibaba stock has been trading largely sideways for much of the past two years after its large-scale collapse in 2021. Shareholders have grown used to BABA stock trending in the $60s and $70s, prices it traded at a full decade ago.
The 50-day Simple Moving Average has remained below the 100-day counterpart since October 16 of last year. With the fiscal Q3 result in the bag, there are no near-term catalysts for BABA. Even an extremely generous $25 billion buyback announcement couldn’t whet appetites.
Near-term support might hold at $73.28, a long-term fortification from March 2022. Further down, the $67 level from January might again come to the rescue. Otherwise, bulls may have to wait for entry at $63.40, a level that saw measured respect in October 2022.
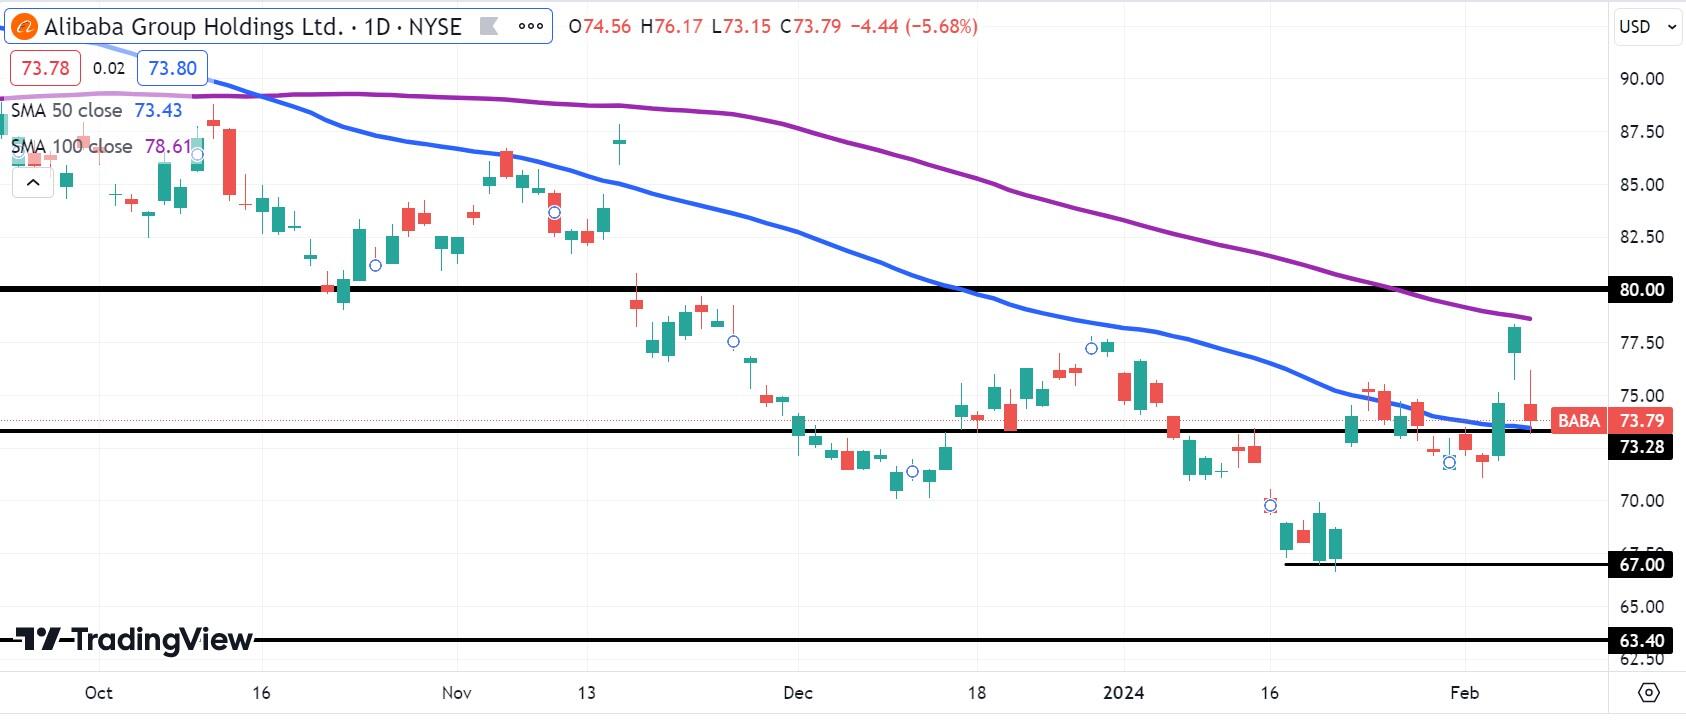
BABA daily stock chart
Information on these pages contains forward-looking statements that involve risks and uncertainties. Markets and instruments profiled on this page are for informational purposes only and should not in any way come across as a recommendation to buy or sell in these assets. You should do your own thorough research before making any investment decisions. FXStreet does not in any way guarantee that this information is free from mistakes, errors, or material misstatements. It also does not guarantee that this information is of a timely nature. Investing in Open Markets involves a great deal of risk, including the loss of all or a portion of your investment, as well as emotional distress. All risks, losses and costs associated with investing, including total loss of principal, are your responsibility. The views and opinions expressed in this article are those of the authors and do not necessarily reflect the official policy or position of FXStreet nor its advertisers. The author will not be held responsible for information that is found at the end of links posted on this page.
If not otherwise explicitly mentioned in the body of the article, at the time of writing, the author has no position in any stock mentioned in this article and no business relationship with any company mentioned. The author has not received compensation for writing this article, other than from FXStreet.
FXStreet and the author do not provide personalized recommendations. The author makes no representations as to the accuracy, completeness, or suitability of this information. FXStreet and the author will not be liable for any errors, omissions or any losses, injuries or damages arising from this information and its display or use. Errors and omissions excepted.
The author and FXStreet are not registered investment advisors and nothing in this article is intended to be investment advice.